

Estimated reading time : 5 min · Published
Choose journeys to measure
Select a home page, a service page, an image-heavy listing, an article and the contact form. Test at least one mobile and one desktop width with representative devices and connections. Record the date, recent changes and elements visible in the first viewport.
Separate laboratory measurements, which help reproduce a problem, from available field data, which describes real visitor experience. If traffic is too low for a stable measure, do not present one score as a trend. web.dev explains measurement tools and their uses.
Fictional exercise: five loads produce the LCP values below before and after a change. The median is the third sorted value, not the mean. Here it moves from 3.5 to 2.9 seconds, 0.6 seconds less for these series. These values illustrate a method; they measure neither this site nor client results.
Keep the same URL, device profile, network and cache settings, and Chrome and Lighthouse versions to make the comparison useful. Retain raw measurements and recorded changes. A five-run median reduces the influence of an unusual run without establishing causation or replacing field data or users’ INP.
- Selected pages and devices.
- Reproducible baseline.
- Task the visitor needs to complete.
Scroll the table horizontally to read every column. With a keyboard, focus the table area and use the arrow keys.
| Series | Observed LCP in seconds | Interpretation |
|---|---|---|
| Before change | 3.6; 3.4; 3.5; 3.7; 3.3 | Sorted: 3.3; 3.4; 3.5; 3.6; 3.7. Median: 3.5 s |
| After change | 2.9; 3.0; 2.8; 3.1; 2.7 | Sorted: 2.7; 2.8; 2.9; 3.0; 3.1. Median: 2.9 s |
| Difference between these medians | 3.5 − 2.9 = 0.6 s | Observed improvement in this exercise, not a promise for all visitors |
Read thresholds without mixing measurement types
The following thresholds apply to the 75th percentile of field data, separately for mobile and desktop. Examine each available measurement. In PageSpeed Insights, an assessment can pass without INP when LCP and CLS are available and good; if LCP or CLS is missing, that assessment cannot be made. A Lighthouse loading test does not supply field INP. Google · PageSpeed Insights.
Between the two thresholds, the metric needs improvement. These three measures do not establish accessibility, content usefulness or successful form delivery.
Scroll the table horizontally to read every column. With a keyboard, focus the table area and use the arrow keys.
| Metric | Good | Poor |
|---|---|---|
| LCP | ≤ 2.5 s | > 4 s |
| INP | ≤ 200 ms | > 500 ms |
| CLS | ≤ 0.1 | > 0.25 |
Find the reason for slow loading
Identify the main element visible during loading and the resource that supplies it. An oversized hero photograph, late request or script dependency can delay LCP. Use an image suited to its displayed size, with HTML dimensions, responsive variants and sensible priority; do not defer the main image without reason.
Then examine fonts, CSS, JavaScript and server responses. Remove genuinely unused resources and avoid downloading every off-screen card immediately. The image guide covers visual preparation and alternatives.
Prevent shifts and keep interactions responsive
Reserve space for images, embeds and messages that appear after loading. Check CLS throughout reading, not only in the first screenshot. Late fonts and banners can move a button just as a visitor tries to use it.
For INP, try important actions: open a menu, filter a list, choose an option and correct a form. If the response is slow, inspect long JavaScript tasks and the rendering triggered by each action. A simpler interface may help more than another library.
Set a budget and check after release
Set proportionate limits for main images, cards and new scripts. Compare bytes actually downloaded on mobile rather than the total size of the image library. Record what was removed, compressed or deferred and confirm that visual quality and accessibility remain sound.
Repeat journeys after each change and after deployment. Follow LCP, INP and CLS when real-user data is available, without promising that a score guarantees search ranking. Google guidance on page experience puts these metrics within the broader usefulness of the site.
- Bytes and delays before and after.
- No visual or functional regression.
- Checks on priority pages and devices.
Identify a slow resource while distinguishing network, compression and cache.
Synthetic case: an image appears slowly despite lightweight HTML. Compare loading stages and sizes under identical conditions, then repeat with cache. Details for cross-origin resources may be restricted. A zero size alone therefore does not establish that a transfer was free or instantaneous.
- The comparison records resource, cache state and visibility limits without turning missing data into a measured gain.
- MDN Resource Timing
Documentation of network timings and sizes exposed by performance entries for loaded resources.
Compare loading conditions
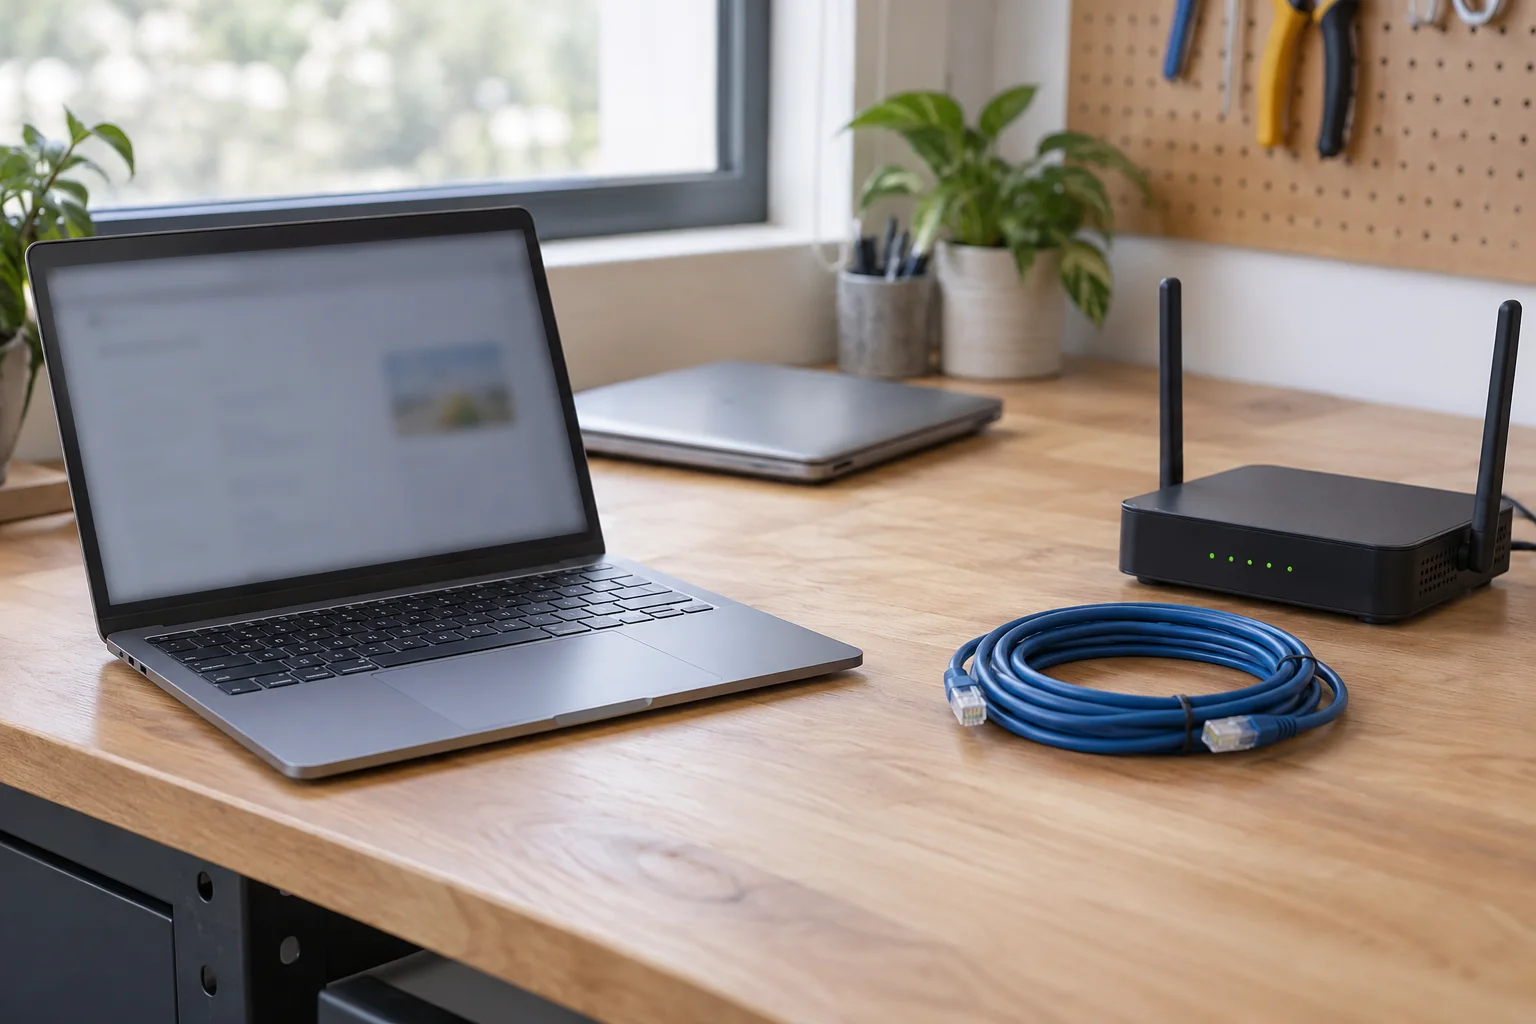
Proposed case: a page feels fast after several visits but slow on first access. Cache, images and scripts may change the observed experience.
Compare documented device, network, cache and page conditions. Keep main element, requests and observed timings before and after; one measurement does not prove a lasting gain.
- Record network and cache state
- Identify the main content
- Compare several consistent observations
- Check the useful crop
How to choose and prepare website images
After a fix, follow the right measurement window
- Record the version
- Repeat the same test
- Check URL or origin
- Follow field data
A test rerun today examines the current version under its simulation conditions. Field reporting also retains older experiences within its 28-day window. First check whether that report covers the URL or the origin: a site-wide result cannot isolate the corrected page.
Do not change the device, page and network conditions at the same time as the correction. Retain values, not just colours or the overall score. Missing data remains an absence of measurement.
Reference documents
- web.dev : Cumulative Layout Shift · Source consulted
- MDN Resource Timing · Source consulted
- web.dev : Optimize LCP · Source consulted
- Chrome : UX Report
- Chrome : Lighthouse performance scoring · Source consulted
- web.dev · Lab and field data differences · Source consulted
- Google · PageSpeed Insights · Source consulted
- web.dev explains measurement tools
- Google guidance on page experience
Further reading
For a joint product and technical review, this method relates critical journeys to dependencies, safeguards and review evidence. It complements speed measurements with an examination of the action visitors need to complete. Check thresholds and tools in their official documentation.
Cyber Intelligence Embassy : journey-led website audit (French)
Content updated on
Documented reference points for this topic
| Reference | Value or syntax | Scope |
|---|---|---|
| HTTP · 304 | If-None-Match → 304 | For a GET or HEAD request, an unchanged representation can be reused without resending its body. |
Dates indicate when references were consulted. These facts are neither a site audit nor an overall compliance statement.